User Manual of Web3DMol
Introduction
Web3DMol is an application used for displaying 3D structure of proteins on web browsers.
PDB files
3D structure graphics as well as other important information
Technology
| Browsers | Support Version | Support Since |
| Chrome | 8.0+ | Dec 02, 2010 |
| Firefox | 4.0+ | Mar 22, 2011 |
| Safari | 5.1+ | Jul 20, 2011 |
| Opera | 12.1+ | Nov 05, 2012 |
| Internet Explorer | Edge | Jul 29, 2015 |
| iOS Safari | 8.0+ | Sep 17, 2014 |
| Opera Mini | Not Supported | - |
| Opera Mobile | 37+ | Sep 23, 2016 |
| Android WebView | Chromium 56+ | Feb 01, 2017 |
| Chrome for Android | 57+ | Mar 27, 2017 |
| Firefox for Android | 52+ | Mar 27, 2017 |
Usage
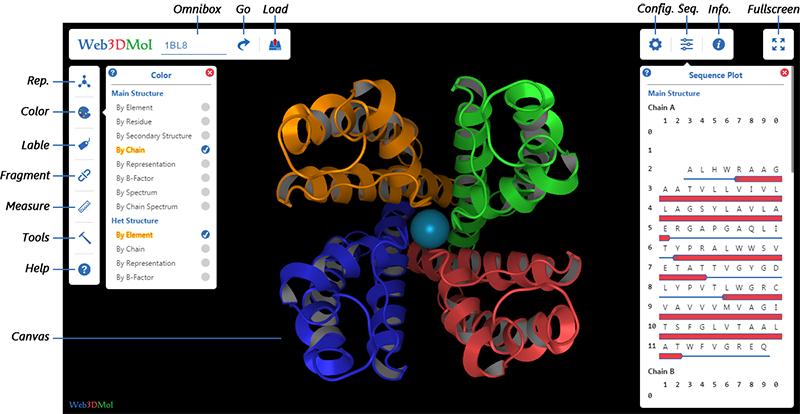
Initialization
Three ways to initialize Web3DMol :
1. Visit https://web3dmol.net
2. Download source code, unzip and double-click
3. Embed Web3DMol into other applications, then initialize the application.
Load PDB
Load from RCSB
Input PDB-ID in Omnibox, then press ENTER key or click GO button.
Load from Local File System
1. Click Load button, then select a pdb file from local file system.
2. Simply drag a pdb file from local file system and drop it into Web3DMol interface.
(
Interaction
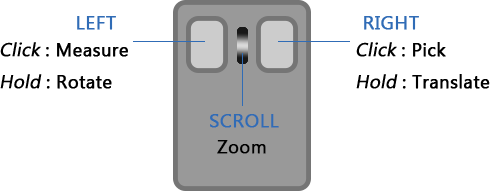
Press & hold
Press & hold
Scroll
Click
Click
( A measurement must be started before left-click takes effect. )
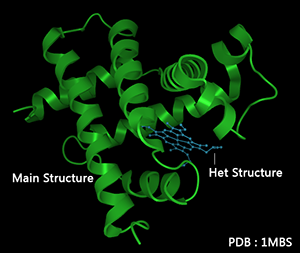
Main & Het Structure
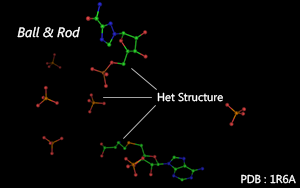
There are two different kinds of atom recorded in PDB files.
Representation Mode
Representation mode can be adjusted in
Show nothing.
Atom are shown as dots.
Atoms are connected by line according to residues' molecular structure.
Atoms in the main chain are connected by tubes.
Residues are connected along the main chain by tubes.
Residues are connected along the main chain according to secondary structure.
By default, α-helix and β-sheet are connected by cubes, random coils are connected by tubes.
Residues are connected along the main chain by tubes.
Tube's radius varies according to the B-factor (temperature factor).
Residues are connected along the main chain by cubes.
The connector's cross section is rectangle.
Residues are connected along the main chain.
The connector's cross section is like a playground racetrack.
Residues are connected along the main chain.
The connector's cross section is oval.
Residues are connected along the main chain.
The connector's cross section is like a dumbbell.
The first and last residue are connected by a straight tube.
The radius of tube is much fatter than radius in Tube Mode.
( NOTE : Only available for α-helix in Cartoon Mode. )
Residues are connected along the main chain by cubes.
The width of cube at last residue varies to make an arrowhead.
( NOTE : Only available for β-sheet in Cartoon Mode. )
Atoms are connected by tube according to residues' molecular structure.
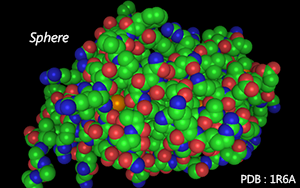
Atoms are shown as spheres.
The radius of spheres varies according to atoms' van der Waals radius.
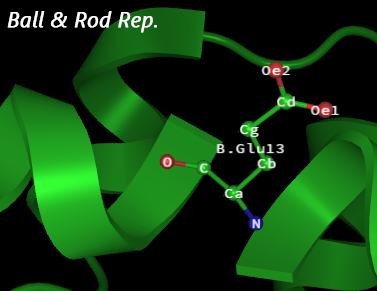
Atoms are shown as spheres and connected by thin rods.
( NOTE : Only available for Het Structure or Single Residue. )
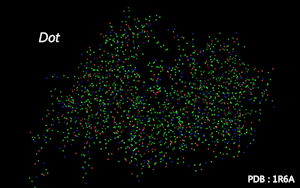
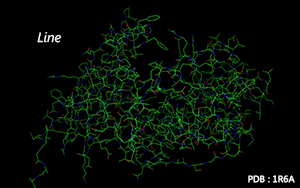
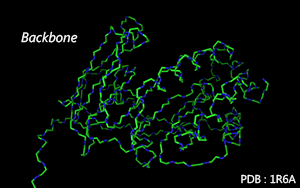
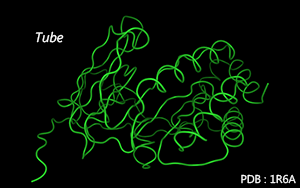
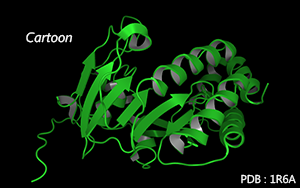
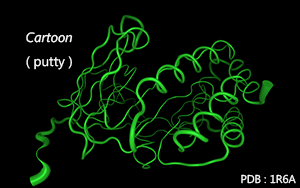
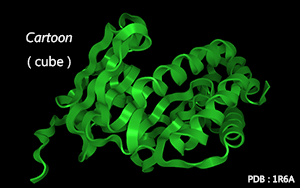
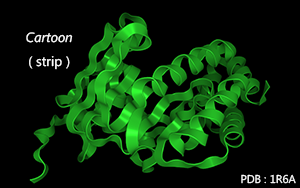
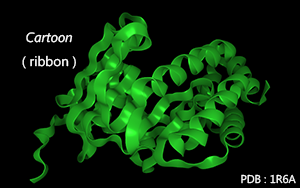
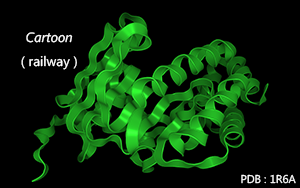
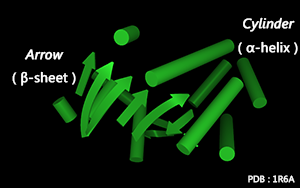
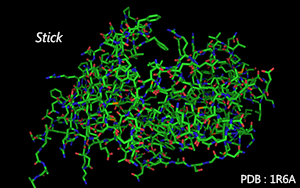
Color Mode
Color mode can be adjusted in
Color Scheme ( see Color Scheme department ) can be adjusted in
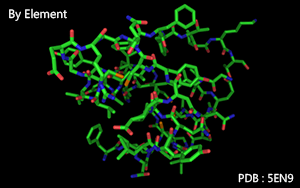
Color by element.
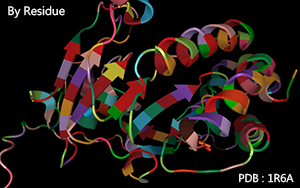
Color by residue.
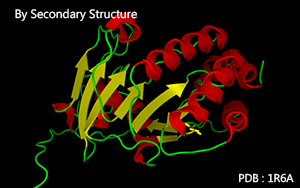
Color by the secondary structure.
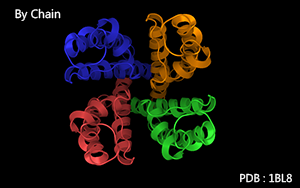
Color by chain identifier.
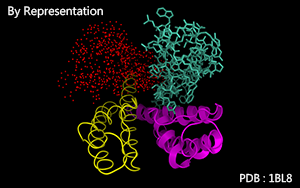
Color by representation modes.
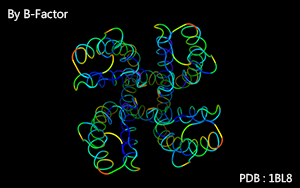
Color as a spectrum according to B-Factor.
B-Factor :
( For those b-factor is not recorded, green color will be used. )
Color as a spectrum according to atoms' serial number.
Serial number :
Color as a spectrum according to residues' sequence number in a chain.
Sequence number :
Color as a spectrum according to residues' hydrophobicity
Hydrophobicity :
Color by user.
( NOTE : Only available in Fragments Customization. )
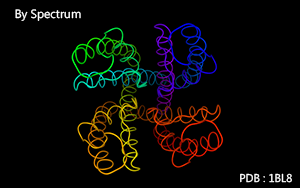
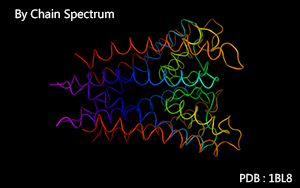
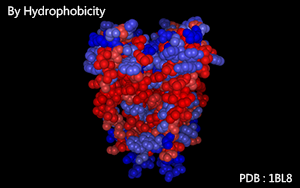
Label
There are two dimensions for label:
What will be labeled.
What will be labeled with.
Label Area & Label Content can be adjusted in
Label's color and size can be adjusted in
Label Area
Label nothing.
Label every atom.
Label atoms in the main chain.
Label representative atom of every residue.
Label the first atom of every chain.
Label the first atom of the molecule.
Label Content
Label with atom name. ( eg. Ca )
Label with atom serial number. ( eg. 20 )
Label with atom name and atom serial number. ( eg. Ca-20 )
Label with element name. ( eg. C )
Label with element name and atom serial number. ( eg. C-20 )
Label with residue name. ( eg. Tyr )
Label with residue sequence number. ( eg. 2 )
Label with residue name and residue sequence number. ( eg. Try45 )
Label with chain identifier. ( eg. A )
Label with chain identifier, residue name and residue sequence number. ( eg. A.Try45 )
Label with chain identifier and residue sequence number. ( eg. A.45 )
Label with chain identifier, residue name, residue sequence number and atom name. ( eg. A.Try45-Ca )
Label with the atom's occupancy recorded in PDB file. ( eg. 1.00 )
Label with the atom's b-factor recorded in PDB file. ( eg. 50.00 )
Label with the atom's van der Waals radius. ( eg. 1.70 )
Fragment
A fragment is a segment of a chain in a molecule.
Fragments can be
Fragments can be
How to add a fragment ? ( Three ways )
1. Click Add Fragment button in
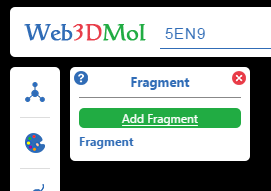
2. Click Fragment checkboxes in
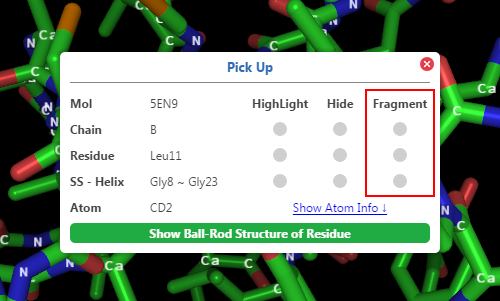
3. Hover above the
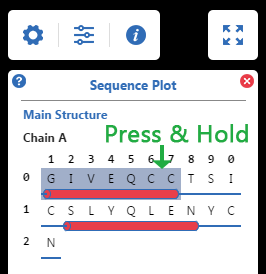
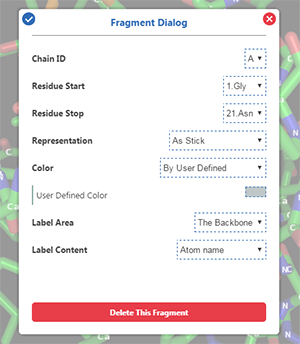
A fragment has its own representation mode, color mode, label area and label content, which can be customized by users in
The chain identifier of a fragment.
The first residue of a fragment.
The last residue of a fragment.
The representation mode of a fragment.
The color mode of a fragment. User-defined color is available.
The label area of a fragment.
The label content of a fragment.
Highlight, Hide & Delete
Click Delete button in
Measure
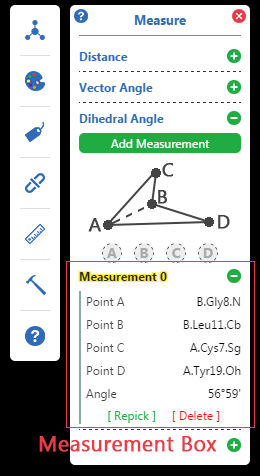
Processes of Measurement
Click Add Measurement button in
Left click the 3D structure to pick atoms by the order of A, B, C and D.
When points are enough, the result will be calculated and show in
Guide lines and Result label will be added to 3D structure graphics.
Points can be repicked by clicking [ Repick ] in
Click the banner of Measurement Box to show / hide this measurement's guide lines.
Other adjustment options can be found in
Tools
Several tools are available in
Extra Structure
Some extra structures can be added into canvas, including:
Animation
3D structure in canvas can rotate by X, Y, Z axes automatically.
The speed of rotation can be adjusted in
Snapshot
3D structure in canvas can be saved as PNG / JPG / BMP pictures.
Share
Click Share URL and copy the URL shown in Share Dialog.
Pass this URL to others or embed it into a web page.
Pickup
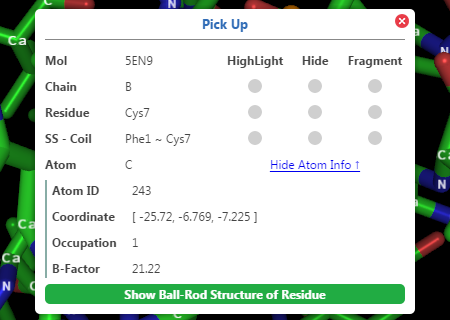
Users can pick atoms by
·
·
·
·
Configuration
Default configurations can be adjusted in
Following configurations are listed by this format:
( NOTE : Increase this option's value will make nicer graphics but consume more computational resources. )
( NOTE : Increase this option’s value will make the path more twisting. )
Default color scheme can be modified in this category.
( also see Color Scheme department )
If local storage is enabled, next time you initialize Web3DMol, configuration values saved at local storage will take place of default one.
Recover the default configuration values
Save current configuration values to local storage
Recover configuration values from local storage
Clear configuration values saved at local storage
( also see Representation Department )
NOTE : values are limited in following integers
( also see Color Department )
NOTE : values are limited in following integers
( also see Label Department )
NOTE : values are limited in following integers
( also see Label Department )
NOTE : values are limited in following integers
Color Scheme
Color mode can be adjusted in
Color Scheme can be adjusted in
For developers, Color Scheme can be redefined by modifying the color value in
Color Scheme are listed by this format:
( NOTE : Color Value is a JavaScript Array, like [ 1.000, 1.000, 1.000 ], representing
Special
Color for Element
Color for Residue
Color for Secondary Structure
Color for Chain
Color for Representation Mode
Sequence
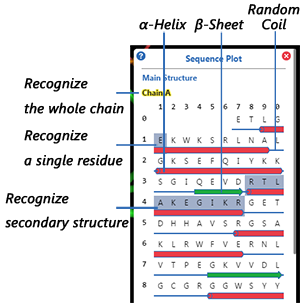
Secondary Structure in Sequence Plot
shown as small red cylinders.
shown as small green arrows.
shown as thin blue strips.
(
Highlight, Hide & Fragment
Hover to recognize a segment, then:
Press & Hold
Information
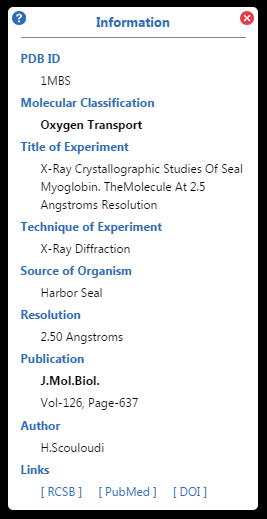
Including :
Molecular Classification, Title of Experiment, Technique of Experiment, Source of Organism, Structural Resolution, Publication, Author etc.
RCSB PDB link of the molecule, PubMed Link and DOI Link of the publication are available in
Extension
Web3DMol can be embedded into other applications.
A typical URL
https://web3dmol.net/?
Configuration values & Color values can be modified to customize the 3D structure graphics.
Configuration keys are listed in Configuration Department in this manual.
Color index are listed in Color Scheme Department in this manual.
Firstly,
Configuration values & Color values must be formatted as JSON String
We recommend using JSON Tools to produce JSON String, such as
Configurations :
Colors :
Next,
Encode the JSON String with URL Encode Tools, such as
The encoded Configuration values will be like :
%7B%22rep_mode_main%22%3A105%2C%22color_mode_main%22%3A602%2C%22bg%22%3A%5B1%2C1%2C1%2C0%5D%7D
The encoded Color values will be like :
%7B%221%22%3A%5B0.5%2C0.5%2C0.5%5D%2C%22102%22%3A%5B0.8%2C0.8%2C0.8%5D%7D
Finally,
The URL will be like :
https://web3dmol.net/?
Using <iframe> in HTML
The typical code :
<iframe width=800 height=500 src="{ the url }" frameborder=0 allowfullscreen></iframe>
Obviously, the value of "src" should be replaced by a new URL, and the values of "width" and "height" could be modified in order to fit the whole layout of your web page.
Using JavaScript
Web3DMol's Library must be loaded into your application at first.
Online Library URL -> https://web3dmol.net/lib/web3dmol.js
We recommend developers to download Web3DMol source code and make it a part of your own application to enhance response speed.
The initialization function is defined like :
w3m.api.init(
user_config & user_color and both
The typical code :
<script type="text/javascript" src="https://web3dmol.net/lib/web3dmol.js"></script>
<script type="text/javascript">
w3m.api.init('app', '1r6a', 1, { user_config }, { user_color });
</script>
Using WebView Component
In desktop environment, a WebView Component must be used to embed Web3DMol.
For example, in Qt, QtWebView is the WebView Component. Developers can set the url attribute of a WebView component with URL we used above, and ensure that the JavaScript Engine in on.
By this way, we can easily embed Web3DMol into a desktop application.
Limitation
3D modeling and rendering are both resource-intensive calculations, and as a form of interpreted language, JavaScript is not good at high efficiency calculations. Therefore, when the size of a molecule becomes very large, Web3DMol sacrifices some graphical quality to maintain the efficiency. Another restriction is from web browser manufacturers. For example, V8, the JavaScript engine in Google Chrome, has a threshold for maximum heap memory usage, so that when the number of atoms is too large, Chrome will crash. In fact, for very large molecules, RCSB PDB does not offer common PDB archives to download. Instead, structural data are recorded in a more complicated format such as mmCIF. Under these conditions, we recommend use of desktop software, for example PyMOL, whose modeling and rendering algorithms are written in C++ (a compiled language).
JavaScript was originally designed for web page interaction, and its function libraries are not abundant. Therefore, it is difficult for Web3DMol to handle PDB archives if they are in zipped format or to record a small movie while users are manipulating the 3D structure.
The support for WebGL from mobile devices is uneven. Web3DMol runs well on some of the latest cellphones, but not very smoothly on most mobile devices at present. The memory capacity, the performance of microchips and the touch-based interactions limit the user experience of Web3DMol on mobile devices.
API
APIs are for developers who use JavaScript to embed Web3DMol into their applications.
w3m.api.init(div_id, pdb_id, show_widget, user_config, user_color)
Initialize Web3DMol.
w3m.api.config(key, value)
Set or Get configuration.
if value is undefined, get and return the configuration value, if value is defined, set the configuration value. ( also see Configuration department )
w3m.api.rgb(index, value)
Set or Get color.
if value is undefined, get and return the color value, if value is defined, set the color value. ( also see Color Scheme department )
w3m.api.refresh()
Refresh the background and the graphics.
w3m.api.pdb(source)
Load a PDB file from a PDB-ID or a local file.
w3m.api.representation(structure, mode)
Switch the representation mode.
w3m.api.color(structure, mode)
Switch the color mode.
w3m.api.label_area(structure, area)
Switch the label area.
w3m.api.label_content(structure, content)
Switch the label content.
w3m.api.fragment_add(chain_id, start, stop)
Add a fragment. This function will return the fragment id of this fragment.
w3m.api.fragment_set(fragment_id, rep_mode, color_mode, label_area, label_content, color_defined)
Customize a fragment.
w3m.api.fragment_remove(fragment_id)
Remove a fragment.
w3m.api.highlight_add(chain_id, start, stop)
HighLight a segment.
w3m.api.highlight_remove(chain_id, start, stop)
Remove the HighLight effect of a segment.
w3m.api.hide_add(chain_id, start, stop)
Hide a segment.
w3m.api.hide_remove(chain_id, start, stop)
Remove the Hide effect of a segment.
w3m.api.picked()
Return the serial number of the atom picked from the 3D structure by user just now.
w3m.api.atom(atom_id)
Return the information of an atom.
The returned value is a JavaScript array :
[ structure_type, atom_id, atom_name, residue_name, chain_id, residue_id, coordinate, occupancy, b-factor, element ].
1 : Main Structure, 2 : Het Structure.
A JavaScript array : [ x, y, z ].
Faq
See FAQ page. ( https://web3dmol.net/faq.html )
Example
See Example page. ( https://web3dmol.net/example.html )
